Overview
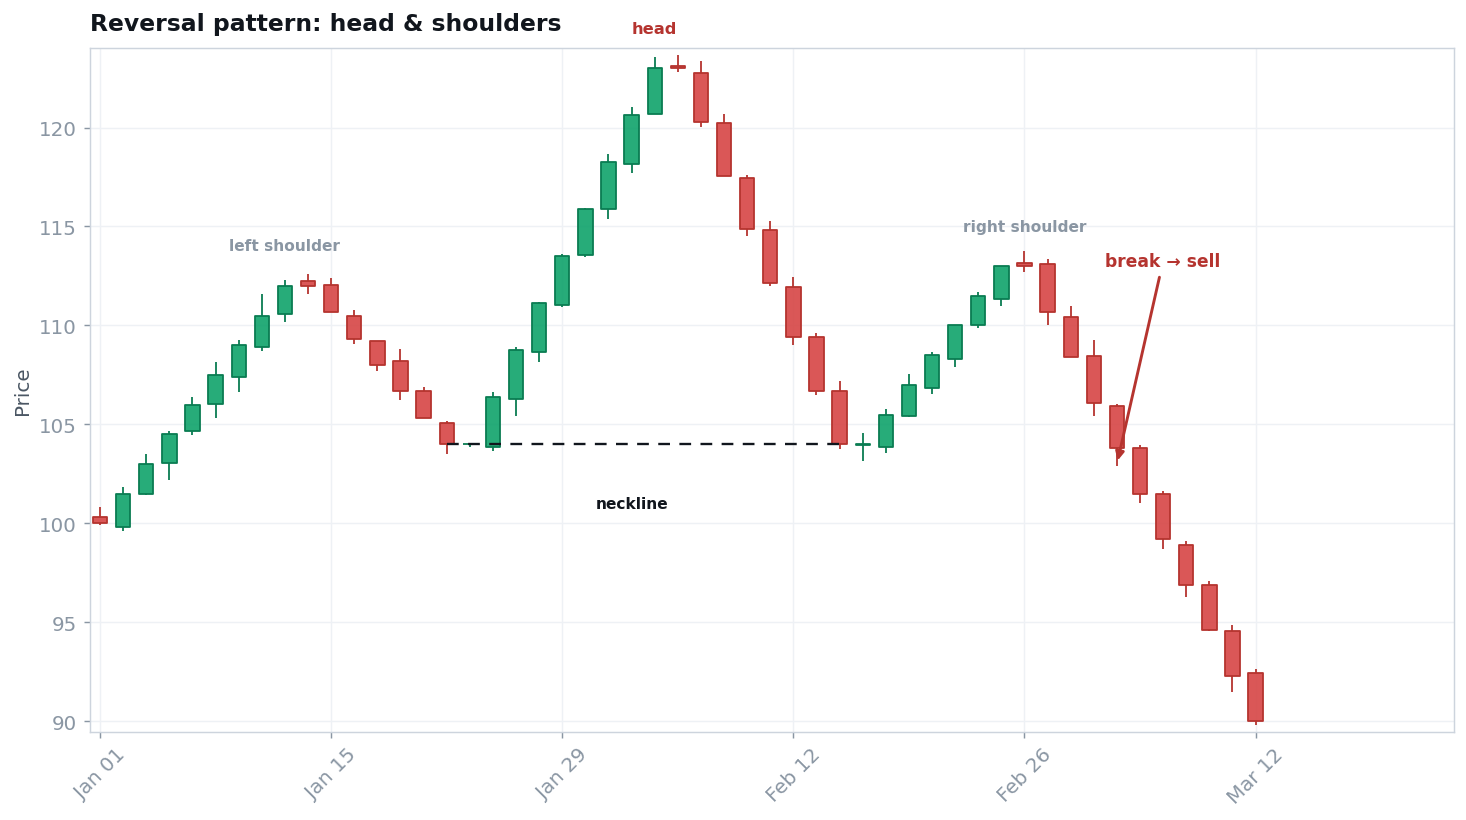
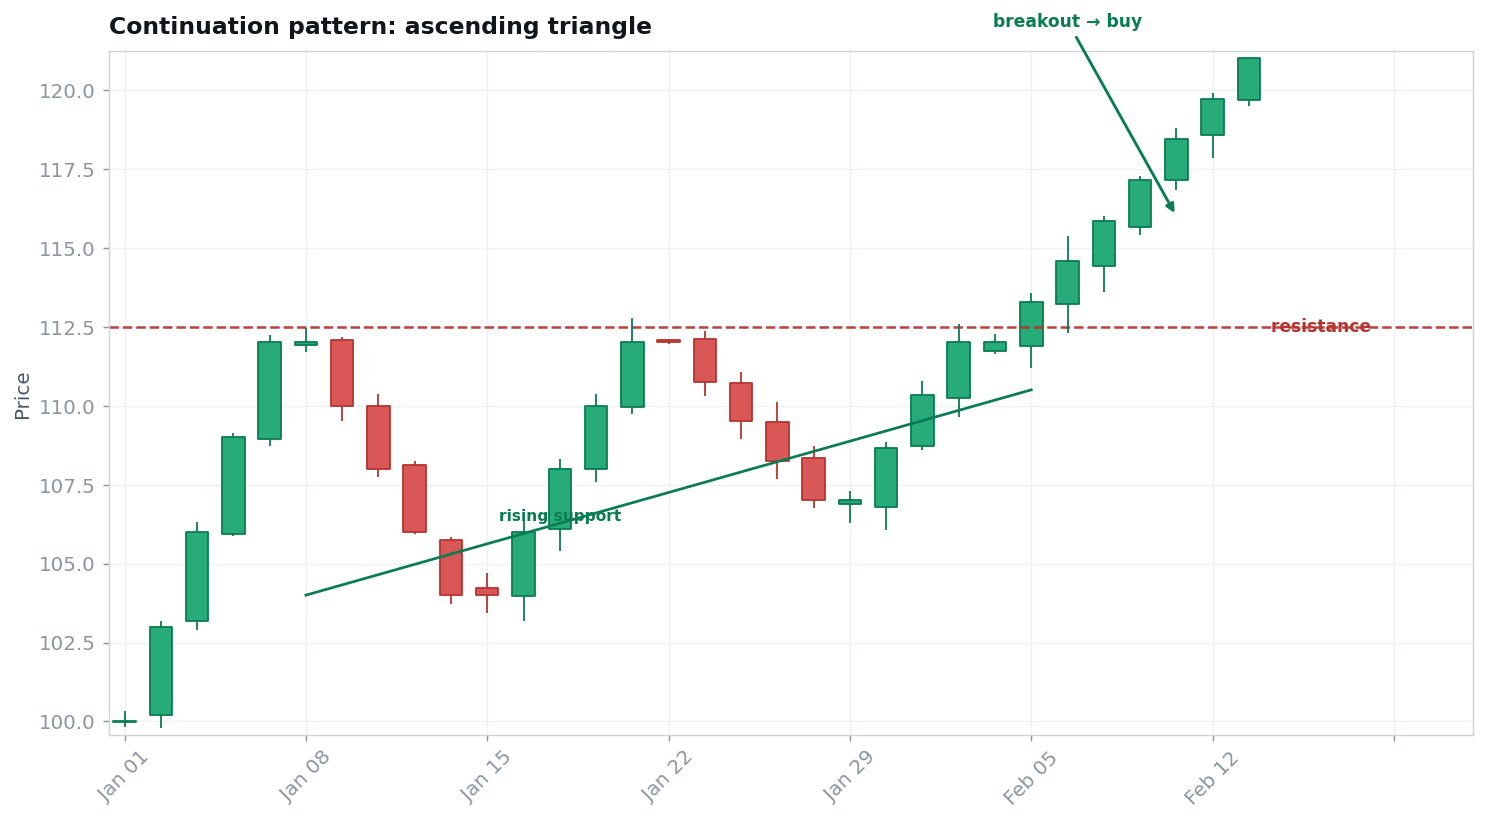
Chart patterns are recurring shapes in price — head-and-shoulders, triangles, flags, double tops and bottoms, cups-with-handles — that traders believe tend to precede a characteristic move. They fall into two families: reversal patterns that mark a turn, and continuation patterns that mark a pause in a trend.
They are the oldest and most popular form of technical analysis — and also the most over-sold, so this is a topic where an honest look at the evidence matters more than usual.
Origins & history
- 1930sRichard Schabacker named many of the classic patterns — including "head and shoulders" and "double top" — in his work on chart reading.1
- 1948Robert Edwards & John Magee codified them for generations in Technical Analysis of Stock Trends — still the canonical reference.1
- ModernThomas Bulkowski, an engineer, brought statistics: his Encyclopedia of Chart Patterns measured roughly 15,000 formations across hundreds of stocks and ranked each pattern by its actual performance.2
How it works
Most patterns share the same three parts: a formation (the shape), a trigger (a breakout of the pattern's boundary, ideally on rising volume), and a measured-move target (a projected objective based on the pattern's height). The breakout — not the shape alone — is what turns a picture into a trade.
Market psychology & mechanics
A good pattern is a picture of the supply-and-demand battle. A head-and-shoulders top, for example, is the story of buyers making a final push to a new high (the head), failing, and then being unable to better the previous peak (the right shoulder) — a visible shift from accumulation to distribution. A triangle is a coil of narrowing disagreement that must eventually resolve. The shapes matter because they encode who is winning.
Honest assessment
The evidence — read this carefully
There is real signal here. The academic study by Lo, Mamaysky & Wang (2000) applied automated pattern recognition to decades of US stocks and found that several patterns — including head-and-shoulders and double-bottoms — do carry incremental information. Patterns are not pure noise.3
But the popular "success rates" are misleading. The headline "this pattern wins 80–90% of the time" numbers are cherry-picked from textbook-perfect examples and depend entirely on how you define success. Bulkowski's own large-sample statistics are far more sober — for many patterns only about half reach their measured-move target, with meaningful failure rates.2
Evidence rating: small, genuine statistical content — but highly dependent on context, volume confirmation, and an objective definition. The marketing win-rates are not real.
Weaknesses & failure modes
- SUBJECTIVERecognition is in the eye of the beholder. The "perfect" pattern is obvious only in hindsight; in real time, ten traders see ten different shapes.
- FAILUREBreakouts fail often. A large share of pattern breakouts reverse — without volume and context, many barely beat random.
- HINDSIGHTSurvivorship in the examples. Books show the winners; the failures are quietly omitted.
- CROWDEDEveryone sees the same picture. Obvious patterns are obvious targets for stop-runs.
Professional uses vs. retail misuses
How professionals use them
- As context, confirmed by volume and a real breakout — never the shape alone.
- With a defined invalidation (the level that kills the pattern) and measured-move target.
- Weighted by Bulkowski-style statistics, not folklore.
Common retail misuses
- Trading the shape before the breakout.
- Believing the "90% win-rate" marketing numbers.
- Drawing the pattern they hope to see.
Going deeper
The families: reversals (head-and-shoulders, double/triple tops and bottoms, rounding tops) and continuations (flags, pennants, triangles, rectangles, cup-with-handle). Tools: the measured move, volume confirmation, and Bulkowski's performance rankings. Related: patterns are really just support/resistance and trend structure drawn as shapes.
Practice
Quiz 1 — What actually triggers a chart-pattern trade — the shape, or something else?
The breakout of the pattern's boundary, ideally on rising volume. The shape is only a setup; the breakout (and its confirmation) is the trigger. Trading the shape early is a common mistake.
Quiz 2 — A site advertises an "85% win-rate" head-and-shoulders. Should you believe it?
Be skeptical. Such numbers come from cherry-picked textbook examples and definition-dependent measurement. Large-sample statistics (Bulkowski) are far more modest — often only about half reach target.
Quiz 3 — Do chart patterns contain any real signal at all?
Yes — a small one. Lo, Mamaysky & Wang found head-and-shoulders and double-bottoms carry incremental information. But the edge is small and context-dependent, not the easy money the marketing implies.
This concept in the knowledge graph
Resources
- PLAYBOOKCup-with-Handle & Candlestick Reversal.
- CONCEPTSupport & resistance & Volume (what confirms a pattern).
- GLOSSARYBreakout, cup with handle, bull flag.
References (primary where possible)
- Origins — Richard Schabacker (named the patterns) and Edwards & Magee, Technical Analysis of Stock Trends (1948).
- Thomas Bulkowski, Encyclopedia of Chart Patterns — measured performance statistics — thepatternsite.com.
- Lo, Mamaysky & Wang, "Foundations of Technical Analysis," The Journal of Finance, 2000 — Wiley.