1 The Edge — why it works
A reversal candle is a story about who just won
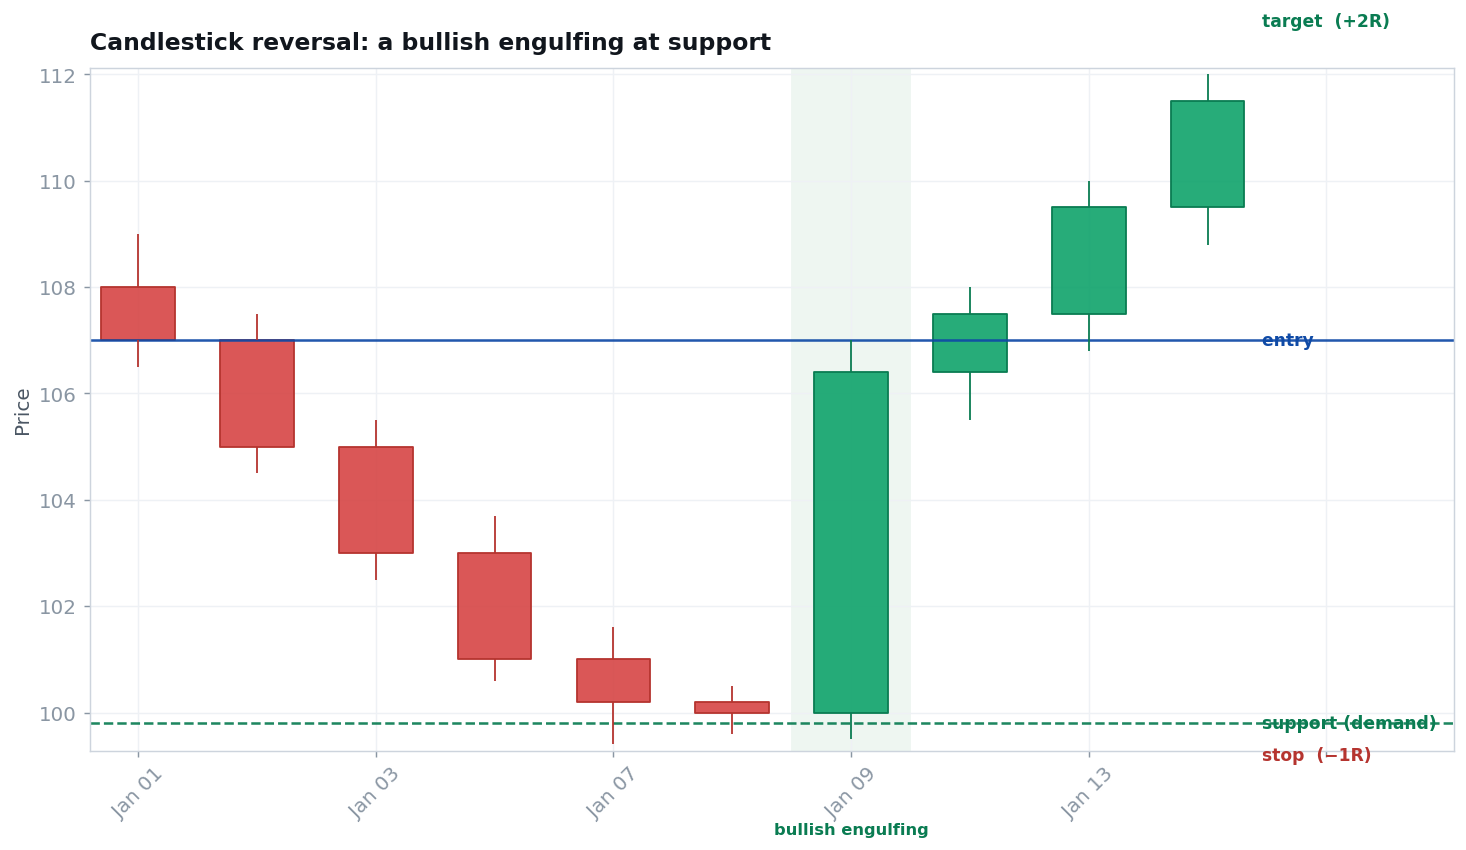
A candlestick draws the fight between buyers and sellers in one bar. A bullish engulfing — a green body that swallows the prior red one — or a hammer — a long lower wick that rejects lower prices — says sellers pushed and failed. On its own that is noise. But when it forms at support, where demand has stepped in before, the candle and the level agree, and the odds of a bounce rise.
Location is everything. The same engulfing candle in the middle of nowhere means little; at a tested support level it is a high-quality, well-located signal with an obvious place to be wrong.
2 Where it works — and doesn't
Conditions matter more than the pattern
Works best when…
- A clear, previously respected support level (or demand zone).
- A clean reversal candle — engulfing, hammer, or piercing — right at it.
- Confirmation: the next bar follows through in the new direction.
- A market that respects technical levels (liquid, orderly).
Fails / avoid when…
- A reversal candle floating with no level behind it.
- A strong trend slicing straight through support.
- Acting on the candle before any follow-through.
- Choppy, illiquid markets full of false signals.
3 Setup checklist
All true before you act
- ✓A level that matters. Price is at a previously respected support (or resistance) zone.
- ✓A genuine reversal candle. A bullish engulfing, hammer, or piercing line — not an ambiguous bar.
- ✓Follow-through. The next candle confirms by closing in the reversal's direction.
- ✓A sane stop. There is a logical low just beyond the candle to be proven wrong.
4 The process
From signal to managed trade
Entry
Buy on the close above the reversal candle (or as the next bar confirms) at support.
Stop (1R)
Just below the low of the reversal candle / the support zone. Entry − stop = 1R.
Position size
Risk a small fixed % of the account; shares = risk ÷ 1R.
Exit & manage
Target the next resistance or a fixed multiple (+2–3R). It is a reversal trade — take the move; trail if it turns into a trend.
5 Worked example (illustrative)
One trade, start to finish, in R
| Account / risk per trade | $25,000 · 1% = $250 |
| Support level | $40.00 |
| Entry (close above engulfing candle) | $41.00 |
| Stop (below reversal low) — 1R | $39.00 · 1R = $2.00/share |
| Position size = $250 ÷ $2.00 | ≈ 125 shares |
| Target (prior resistance, ≈ +2.5R) | $46.00 |
| If it works: +2.5R | + $625 (≈ +2.5%) |
| If it fails: −1R | − $250 (≈ −1.0%) |
6 Honest expectancy
Signal plus location
The candle alone is a coin flip; the candle at a real level is an edge. You win a fair share of the time and keep losses tight just beyond the reversal low, so even modest winners pay.
Example: win 50% at +2R, lose 50% at −1R → (0.50 × 2) − (0.50 × 1) = +0.5R per trade. Take the same candle away from a level and the edge disappears. An expectation, never a guarantee.
7 Make it yours
Test before you trade
A no-risk validation routine
Scroll a liquid market. Mark every clean reversal candle that formed right at a tested support or resistance, and require next-bar follow-through. Record the entry, the stop beyond the candle, and a next-level target in R — before revealing the result. Then check the same candles away from any level; the gap in results shows why location matters.
8 Common mistakes
How traders blow this up
- Trading the candle anywhere. Without a level behind it, a reversal candle is just a bar.
- No confirmation. Acting before follow-through gets you caught by continuation.
- Fighting a strong trend. A powerful move can blow through support — respect context.
- Stops too tight. Place the stop beyond the candle's low, not inside its range.
- Marrying the trade. It is a reversal; take the planned target rather than hoping for more.