Overview
A candlestick compresses four prices for a period — open, high, low, close — into a single shape: a body (open to close) and thin wicks (to the high and low). Candlestick patterns are one-to-three-candle formations — doji, hammer, engulfing, the stars — read as signs of a shift in sentiment.
They're the most popular way to read price in the world. They're also a topic where the intuition is wonderful and the hard evidence is humbling — so we'll be honest about both.
Origins & history
- 1700sMunehisa Homma, a wealthy Japanese rice trader, pioneered reading the psychology of the market on the Osaka exchange. His 1755 work The Fountain of Gold is often called the first book on market psychology.1
- 1991Candlesticks were largely unknown in the West until Steve Nison's Japanese Candlestick Charting Techniques introduced and systematised them for US traders.2
How it works
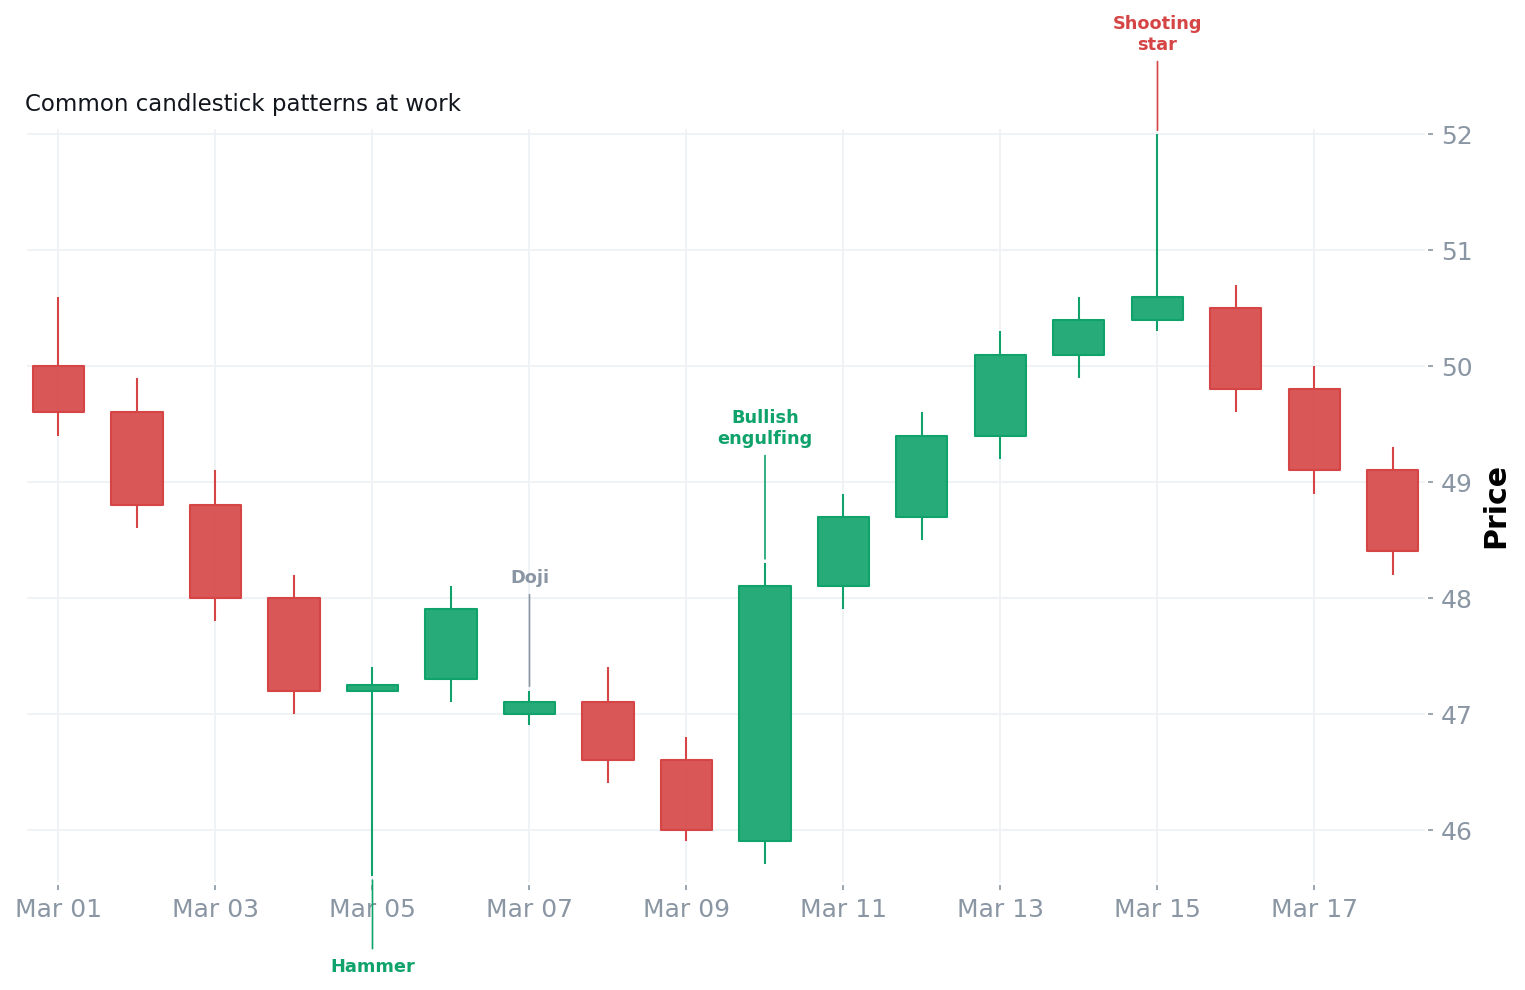
The common patterns each tell a one-bar (or few-bar) story:
- ·Doji. Open and close nearly equal — a standoff, indecision.
- ·Hammer / shooting star. A long wick rejecting one side — buyers (or sellers) slammed price back by the close.
- ·Engulfing. One candle's body completely covers the prior one — a sudden change of control.
- ·Morning / evening star. A three-candle reversal: trend, pause, thrust the other way.
Market psychology & mechanics
This is candlesticks' real gift, and it's Homma's original insight: price is a picture of emotion. A long lower wick says sellers pushed hard and failed — buyers reclaimed control by the close. An engulfing bar says one side decisively overwhelmed the other. The shapes are intuitive because they encode the intraperiod battle between fear and greed in a single, readable image. That descriptive power is genuine — whatever the statistics say about prediction.
Honest assessment
Strengths
Candlesticks are the clearest visual language for reading price and sentiment, and they shine as confirmation — a hammer at support, an engulfing at a key level, on rising volume, is far more meaningful than the candle alone.
The evidence — be honest
The rigorous results are sobering. Marshall, Young & Rose (2006) tested candlestick strategies on Dow Jones component stocks (1992–2002) and found they generated no statistically significant excess returns versus random trading. Some studies in other markets (e.g., Taiwan and China) have found modest short-term profitability, so the picture is mixed — but in developed markets, candlestick patterns as standalone mechanical signals have largely not held up.3
Evidence rating: weak as standalone signals (especially in US/Japan large caps); genuinely useful as a sentiment-reading and confirmation tool within context.
Weaknesses & failure modes
- CONTEXTLocation is everything. A hammer in mid-air means little; the same hammer at a tested support means a lot.
- SUBJECTIVEDefinitions vary. How long is a "long" wick? Traders and software disagree.
- OVERSOLDThe single-candle "magic" is overstated. One candle rarely decides anything on its own.
- NOISELower timeframes are noisy. The smaller the timeframe, the less each candle means.
Professional uses vs. retail misuses
How professionals use them
- As confirmation at a level, with trend and volume — never alone.
- To read sentiment and rejection in real time.
- On higher timeframes, where each candle carries more weight.
Common retail misuses
- Trading any doji or hammer anywhere as a signal.
- Believing the "this candle = reversal" marketing.
- Hunting patterns on 1-minute noise.
Going deeper
The taxonomy: single-candle (doji, hammer, shooting star, marubozu), two-candle (engulfing, harami, piercing), and three-candle (morning/evening star, three soldiers). The key variable is location — candlesticks combine best with support/resistance, trend, and volume. They are a reading tool layered on structure, not a system of their own.
Practice
Quiz 1 — What does a long lower wick (e.g., a hammer) tell you?
That sellers pushed price down during the period but buyers rejected it and reclaimed control by the close — a potential bullish reversal, strongest when it happens at support.
Quiz 2 — Do candlestick patterns reliably predict price on their own?
The rigorous evidence says largely no — Marshall, Young & Rose found no significant edge on US stocks. They're best as confirmation in context, not standalone signals.
Quiz 3 — Why does "location" matter so much for a candle?
Because the same shape means very different things in different places. A hammer at a tested level with volume is meaningful; the same hammer floating in the middle of a range is noise.
This concept in the knowledge graph
Resources
- TRADERMunehisa Homma — the father of candlestick reading.
- PLAYBOOKCandlestick Reversal at Support.
- GLOSSARYCandlestick, doji, hammer, engulfing.
References (primary where possible)
- Honma Munehisa — biography & the origins of candlestick charting — Wikipedia.
- Steve Nison, Japanese Candlestick Charting Techniques (1991) — the Western introduction — overview.
- Marshall, Young & Rose, "Candlestick technical trading strategies: Can they create value for investors?" (DJIA, 1992–2002) — Journal of Banking & Finance.