1 The Edge — why it works
A new N-period high means price has gone somewhere it hasn't been
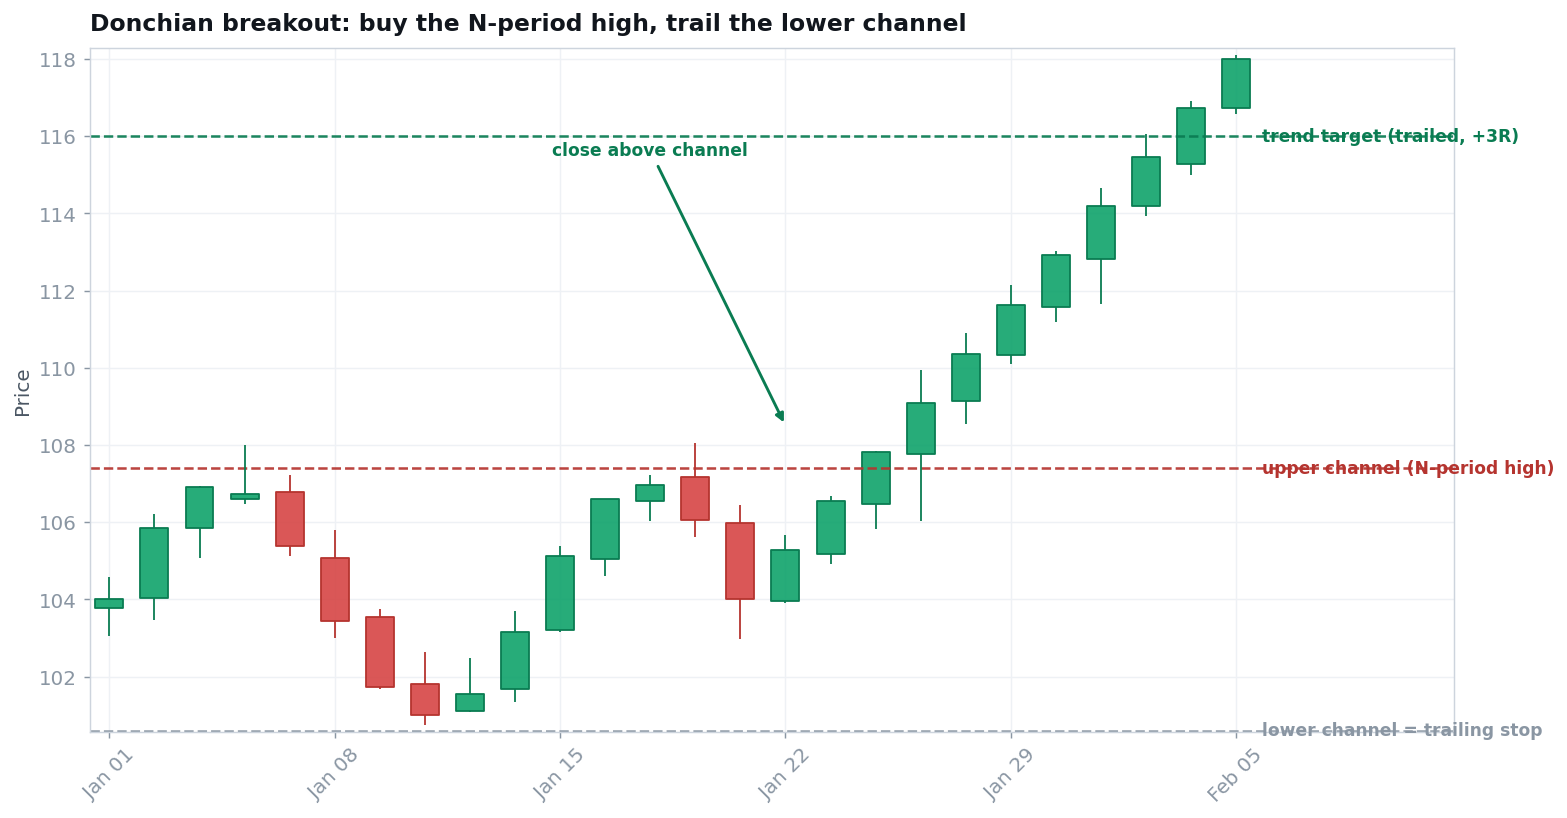
The Donchian channel is just the highest high and lowest low of the last N periods. When price closes above the upper channel, it has broken out of its recent range — the possible start of a trend. You buy that breakout and ride it, using the opposite channel as your exit.
You won't be right often — most breakouts fizzle — but the rare trend that runs pays for all the small losses. That asymmetry is the whole logic of trend following.
2 Where it works — and doesn't
Conditions matter more than the pattern
Works best when…
- Liquid markets that actually trend (indices, futures, large caps).
- A clear directional move, not sideways chop.
- A defined lookback (e.g., 20-day high for entry, 10-day low for exit).
- You're prepared to sit through many small losers for a few big winners.
Fails / avoid when…
- Range-bound, low-volatility chop — endless whipsaws.
- Mean-reverting markets that fade every breakout.
- No trailing exit rule (you give back the whole trend).
- Impatience — bailing on the first winner that pays.
3 Setup checklist
All true before you act
- ✓A defined channel. E.g. the 20-period high for entry and a shorter low (10-period) for the trailing exit.
- ✓A breakout close. Price closes beyond the upper channel — not just an intraday poke.
- ✓Trend & market agree. You're buying breakouts in an environment that trends, not chops.
- ✓An exit defined in advance. The opposite (lower) channel is your stop and trail.
4 The process
From signal to managed trade
Entry
Buy on a close above the N-period high (the upper channel).
Stop (1R)
Use the N-period low (lower channel) or a tighter recent swing low. Entry − stop = 1R.
Position size
Risk a small fixed % of the account; shares = risk ÷ 1R.
Exit & manage
Trail with the channel — exit when price closes below the shorter lower channel. Let winners run; don't cap the trend.
5 Worked example (illustrative)
One trade, start to finish, in R
| Account / risk per trade | $25,000 · 1% = $250 |
| Entry (close above 20-day high) | $52.00 |
| Stop (10-day low) — 1R | $49.00 · 1R = $3.00/share |
| Position size = $250 ÷ $3.00 | ≈ 83 shares |
| Trend runs (trailed) to +3R | $61.00 |
| If it works: +3R | + $747 (≈ +3.0%) |
| If it fails: −1R | − $249 (≈ −1.0%) |
6 Honest expectancy
Why a low win rate still wins
Trend following loses more often than it wins — most breakouts don't follow through. The edge is letting the winners run far beyond the size of the losers.
Example: win 40% at +4R, lose 60% at −1R → (0.40 × 4) − (0.60 × 1) = +1.0R per trade. Real systems endure long flat stretches and drawdowns between trends. An expectation, never a guarantee.
7 Make it yours
Test before you trade
A no-risk validation routine
Pick one market and one channel length (say 20/10). Scroll years of history and, for each breakout, record the entry, the channel stop, and where a channel-trail would have exited — in R. Tally the win rate and average R, then compute expectancy. You'll feel both the long flat periods and the big trends that justify the method.
8 Common mistakes
How traders blow this up
- Trading it in a range. Channel breakouts whipsaw relentlessly in chop — trend conditions are everything.
- No trailing exit. Without the opposite-channel trail you hand the entire trend back.
- Stops too tight. A stop inside the channel gets you shaken out before the trend starts.
- Cutting winners early. The whole edge is the few trends that run — let them.
- Oversizing. Trend following has losing streaks; size to survive them.
Watch — a 30-year study of this exact system
A reputable, free explainer from this playlist — educational, not an endorsement.
