1 The Edge — why it works
A proper base resolves into the next leg up
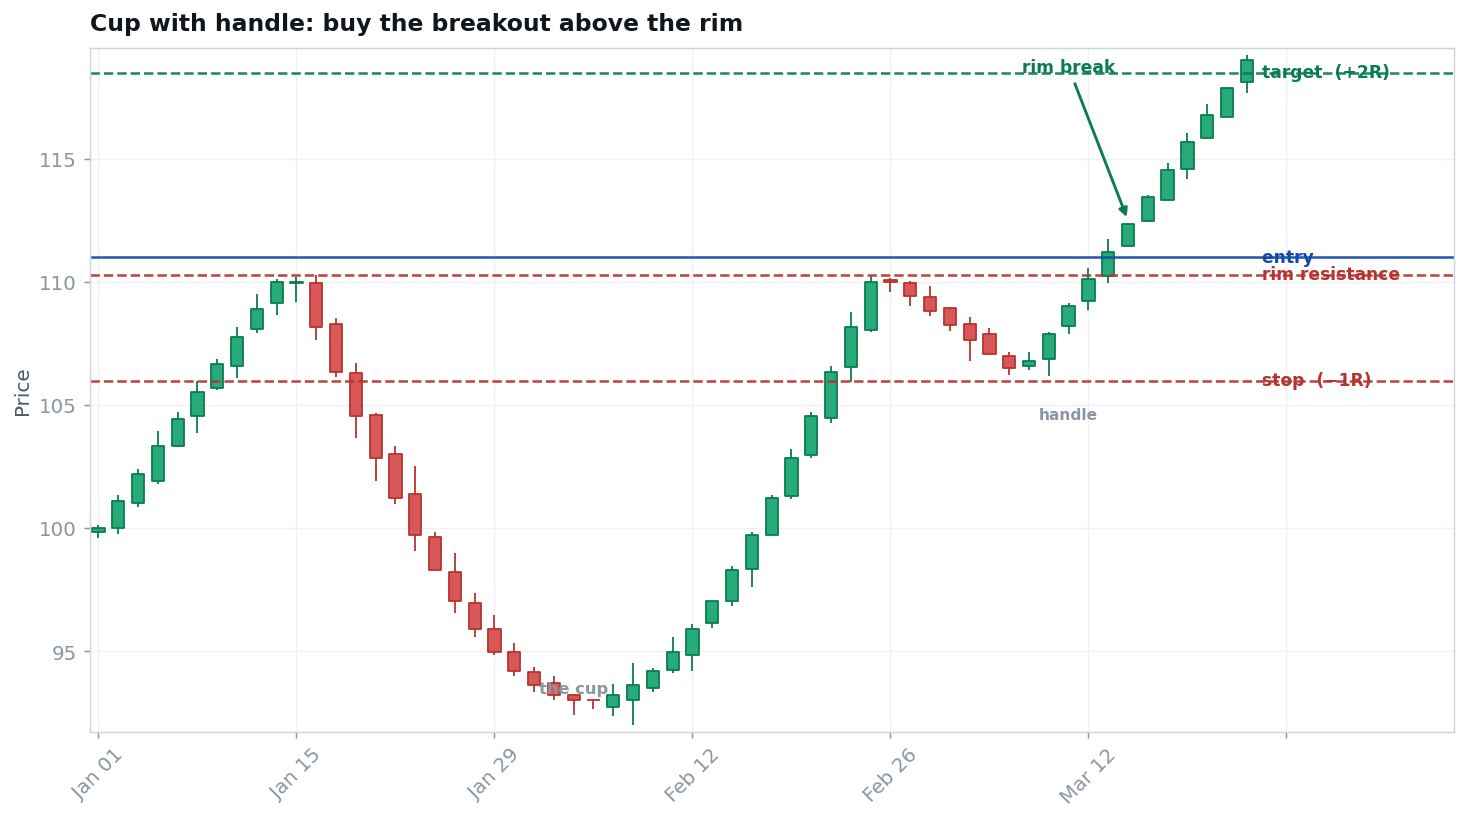
O'Neil studied the biggest winning stocks and found they tend to build the same kind of base before their best runs: a rounded cup that repairs the prior decline, then a short handle that shakes out the last weak holders. The breakout above the rim, on heavy volume, is where demand finally overwhelms the supply that capped the stock — and where the new trend often begins.
The handle is the key tell. A shallow drift on light volume means weak hands are gone; a deep, sloppy handle means there is still real selling to absorb.
2 Where it works — and doesn't
Conditions matter more than the pattern
Works best when…
- A leading stock with strong earnings and relative strength.
- A cup that is reasonably deep and rounded, not a sharp V.
- A short, shallow handle drifting down on light volume.
- A breakout above the rim on a clear surge of volume.
Fails / avoid when…
- A laggard or broken stock with weak fundamentals.
- A deep, wide, or V-shaped 'cup' (no real repair).
- A handle in the lower half of the cup, on heavy volume.
- A breakout on weak volume — prone to fail back.
3 Setup checklist
All true before you act
- ✓A real base. A rounded cup that has repaired a prior decline — weeks or months, not days.
- ✓A proper handle. A short pullback drifting down on light volume, in the upper half of the cup.
- ✓A defined rim. A clear pivot — the high of the handle / rim of the cup — to break.
- ✓Volume on the break. Price clears the rim on volume well above its recent average.
4 The process
From signal to managed trade
Entry
Buy as price breaks above the rim/handle high (the pivot) on expanded volume.
Stop (1R)
Just below the handle low (or the breakout pivot). Entry − stop = 1R.
Position size
Risk a small fixed % of the account; shares = risk ÷ 1R.
Exit & manage
Hold for the trend; trail under higher lows or a moving average. Cut quickly if the breakout fails back below the pivot.
5 Worked example (illustrative)
One trade, start to finish, in R
| Account / risk per trade | $25,000 · 1% = $250 |
| Entry (breakout above rim) | $60.00 |
| Stop (below handle low) — 1R | $56.40 · 1R = $3.60/share |
| Position size = $250 ÷ $3.60 | ≈ 69 shares |
| Trend runs (trailed) to +3R | $70.80 |
| If it works: +3R | + $746 (≈ +3.0%) |
| If it fails: −1R | − $248 (≈ −1.0%) |
6 Honest expectancy
Quality bases, asymmetric payoff
You take fewer trades but only in confirmed leaders breaking from real bases. Many breakouts still fail near the pivot for a small loss; the winners that follow through become full trend moves.
Example: win 40% at +4R, lose 60% at −1R → (0.40 × 4) − (0.60 × 1) = +1.0R per trade. The method depends on a healthy market producing leaders. An expectation, never a guarantee.
7 Make it yours
Test before you trade
A no-risk validation routine
Pull up past big-winning stocks and find the base before their best run. Mark the cup, the handle, the rim/pivot, and the volume on the breakout. Record the entry, the below-handle stop, and how far the move ran in R — before checking the outcome. You will start to feel the difference between a proper base and a sloppy one.
8 Common mistakes
How traders blow this up
- Chasing past the pivot. Buying well above the rim makes the stop huge and the reward/risk poor.
- A faulty handle. A deep handle on heavy volume means the base has not finished.
- Ignoring volume. A rim break without volume is a likely fake-out.
- Buying laggards. The method is for leaders with strength, not cheap turnarounds.
- Holding a failed break. If price falls back below the pivot, take the small loss.