Where a moving average follows price, an oscillator measures its momentum — how fast and how stretched a move is. Most swing between bounds, so they flag when a market is \‘overbought\’ or \‘oversold,\’ and, most usefully, when momentum quietly disagrees with price.
RSI
The Relative Strength Index runs 0–100. Above ~70 is often called overbought, below ~30 oversold — but in a strong trend it can pin at an extreme for a long time.
MACD
Built from two moving averages plus their difference (a histogram). It reads the trend\’s strength and turns — a blend of trend and momentum in one tool.
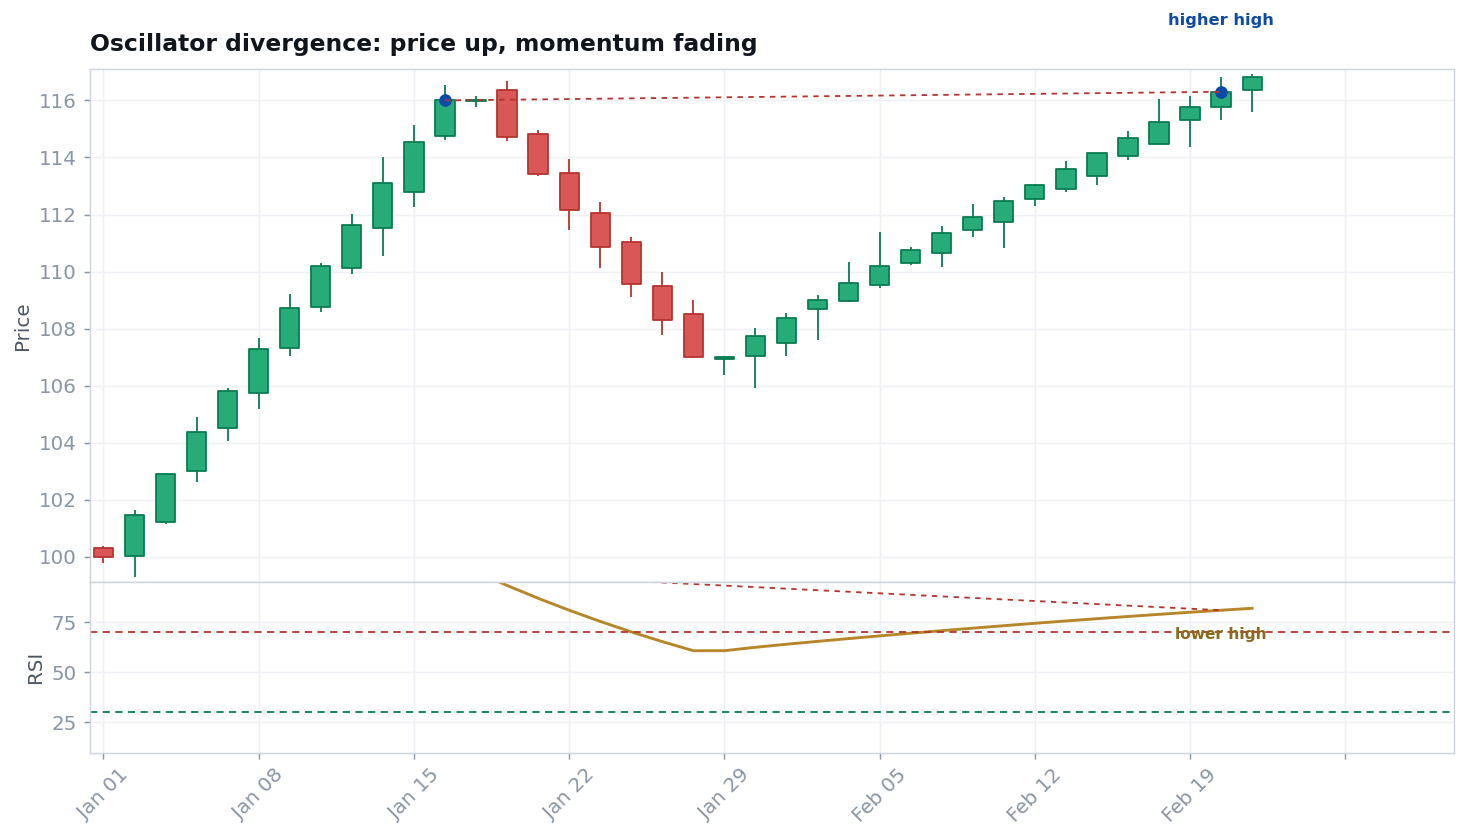
Divergence
The highest-value signal: price makes a higher high while the oscillator makes a lower high (or vice-versa). Momentum is fading even as price pushes on.
Not a standalone
Oscillators lie in strong trends. Use them with structure and trend — as confirmation, not as a buy/sell button.
See also
- DEEP DIVEMACD — the definitive guide.
- DEEP DIVERSI — the definitive guide.
- CONCEPTMoving Averages — MACD is built from them; Volume — another conviction read.
- TRADERAlexander Elder — the Triple Screen; Linda Raschke — momentum & oscillators.
- COURSEMasterclass: the indicators modules